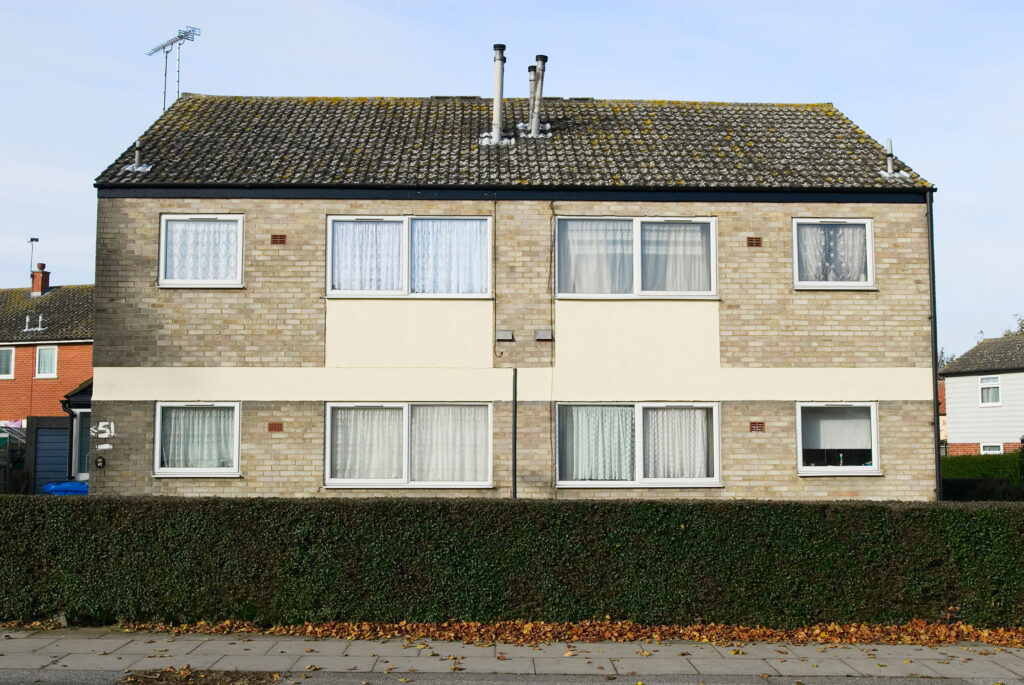
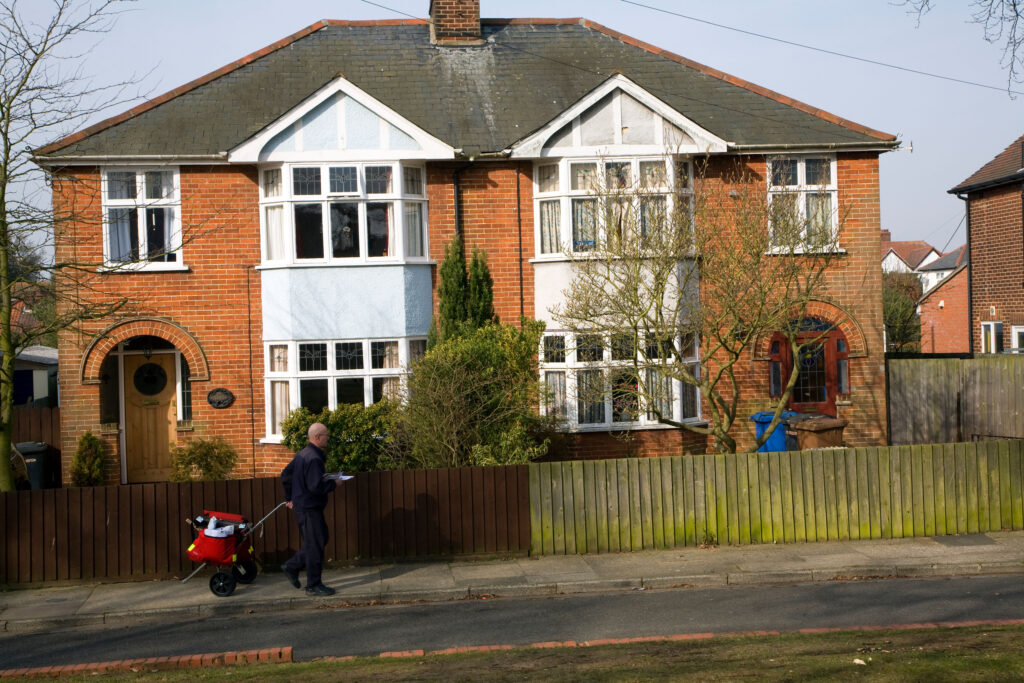
Britain had its fastest ever house price growth not in the 2020s but in the 1970s. Houses then were also getting smaller and worse. The problem was a lack of supply.
The world faces severe housing problems. Prices and rents, particularly in the highest-productivity cities, are growing faster than earnings. Most people consider this problem to be down to insufficient new homes being built in places that people want to live. But another school of thought argues that the solution is on the demand side – either that borrowing has been too easy, or that housing has been ‘financialized’, and that reducing this financialization would make housing affordable without the need to build many more new homes. Others argue that the problem is that borrowing is too difficult for certain people, and the subsidies for homeownership and mortgage borrowing are the best way to respond to high housing costs.
Britain in the 1960s and 1970s provides a dramatic example of both of these approaches being tried, as a by-product of other policies that were being pursued at the time.
Subscribe for $100 to receive six beautiful issues per year.
During the 1960s, the government unintentionally caused mortgage rationing as a side effect of trying to run a trade surplus and defend the pound. And this did restrain measured overall house price growth. But it also led to ‘shrinkflation’ in the housing market, with housebuilders building smaller and lower-quality housing for the same price.
After this, during the 1970s, the second approach was tried, when restrictions on borrowing were lifted. This, alongside recently introduced subsidies for homeownership, caused the fastest period of house price inflation in British history, and created a huge number of new, highly leveraged mortgages. When the government moved to suppress demand again, to avoid another balance of payments crisis, it brought these mortgages to the point of collapse. It was only the inflation of the later 1970s that avoided mass housing defaults and a financial crisis.
There are two lessons from this period. The first is that Britain’s housing problems go back further than people often realize today – housing was deeply dysfunctional as early as the 1960s and 1970s, even though measured prices remained stable for much of this period. The second lesson from this episode is that neither stimulating demand through easy mortgages and housing subsidies nor constraining it through financial repression can improve housing outcomes if supply is restricted. There is no alternative to supply.
The supply of housing before and after 1947
House prices are determined by supply and demand. In the UK, until the 1940s, whenever demand increased somewhere – because of increased population or incomes, or changing industrial patterns moving economic activity around the country – supply rose to meet it. This allowed cities to grow rapidly, sometimes by a factor of 100 in a few decades, in response to new industries like coal mining and cotton textiles.
Property owners could generally build whatever they wanted, wherever they wanted, subject only to safety bylaws. When land became profitable to build on, due to new roads or railways, shifting economic geography, or borrowing becoming cheaper, people built on it or intensified the use of existing land by building up.
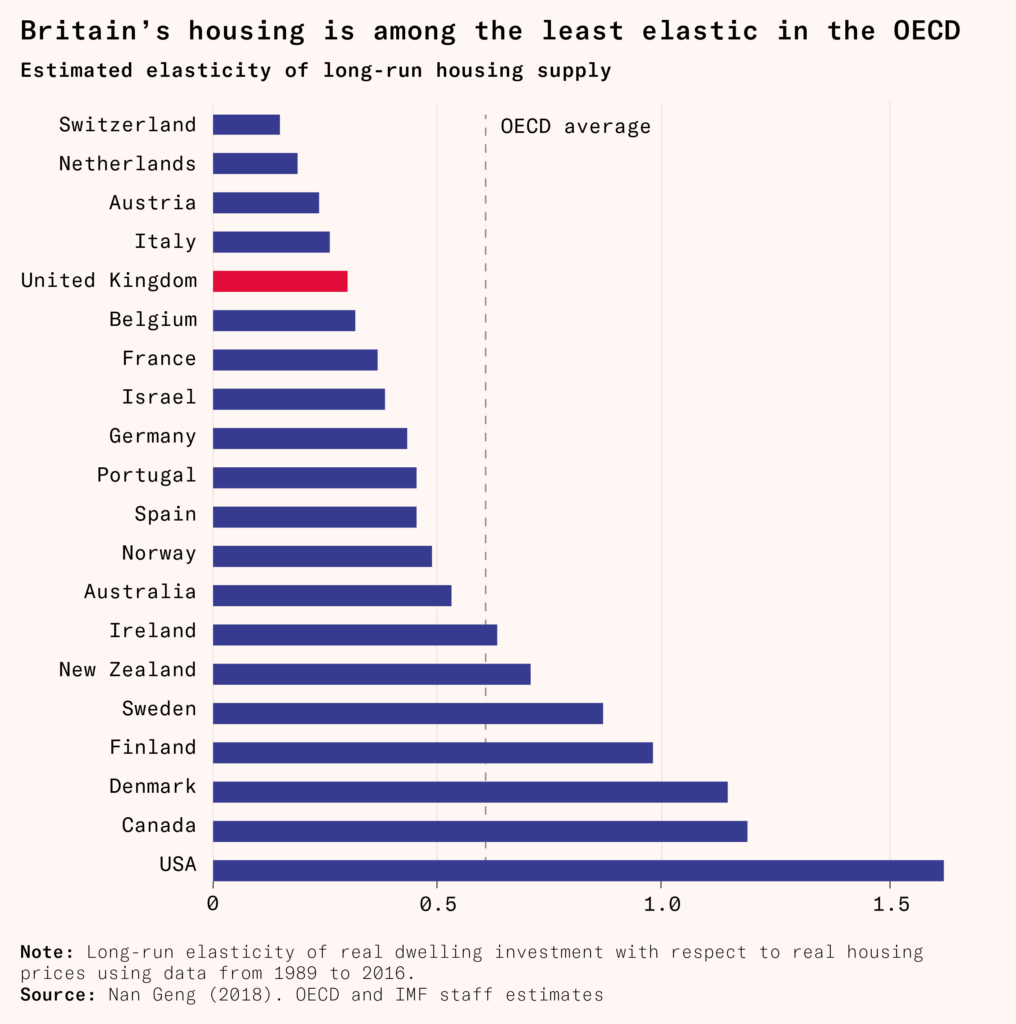
Between 1850 and the 1940s, the ratio of house prices to incomes fell steadily, to a point in the 1930s where average house prices were equivalent to about four or five years of an average person’s earnings. Today in the UK the ratio of average prices to earnings is about nine to one.
Britain’s governments have long been aware of this problem. Nearly all of them have been committed in principle to development. In the postwar period, they attempted to encourage local authorities to build high-density social housing to compensate for a lack of greenfield land with permissions, and set up central bodies such as land commissions and regional planning boards in failed attempts to enable greenbelt release. Britain still has a five-year land supply rule, similar in principle to California’s builder’s remedy. In practice, however, it does not override greenbelt restrictions. Serious policies to force increases in house building have never been politically sustainable and whenever they have been introduced they have been unceremoniously scrapped before they could provide much extra housing.
These difficulties on the supply side have led many policymakers, academics, and planners to look to the regulation of the demand side to improve affordability. The experience of the 1960s and 1970s in Britain highlights the dangers of this approach.
Mortgage finance under the British building society cartel
Before the First World War, 90 percent of British households rented or leased their home. When mass home ownership began after the end of the war, mortgages were funded not by commercial banks but by what were called building societies, which together controlled about four fifths of total mortgages and kept mortgage interest rates low for existing borrowers, who were typically also people with savings held in the societies.
The building societies had their origin in credit cooperatives where members pooled their funds to build or purchase housing. In 1921 the Treasury gave them preferential tax treatment, which gave them a sufficient advantage that commercial banks could not compete with them.
Until this system was deregulated in the early 1980s, it operated as a cartel, with the interest rate on their savings accounts and the great majority of Britain’s mortgages set centrally by the board of the Building Societies Association. As there was no serious competition in the mortgage market, this inflexible centrally set rate became the mortgage rate offered by all building societies.
In most cases, cartels set prices above the market price to earn higher profits. The building societies differed from most cartels in that they were cooperatives, owned by the people who had savings in and loans from them. They tended to see their role as pooling their members’ resources at a reasonable rate rather than engaging in profit-maximizing commercial activity. Instead of holding mortgage rates artificially high, they used their power as a cartel to hold mortgage rates constant, irrespective of market conditions, to provide certainty to their members.
At that time, all mortgages were variable rate – unlike in the United States today, where mortgage interest rates are usually fixed for 30 years, and in Britain today, where they are usually fixed for two to five years – so any change in rates would be felt almost immediately by all borrowers.
Mortgages are paid back with a stream of flat payments over time. But the outstanding balance that is owed is largest at the very beginning. That means that early payments on a mortgage are largely interest, as there is less space in the fixed payment after the interest has been paid. Over time, as the principal is paid down, more and more of each payment goes toward repaying the loan, and a smaller and smaller fraction to interest.
So small increases in the centrally set interest rate could lead to immediate large increases in monthly payments for some mortgagors. Restraining rate changes muted this effect and protected these borrowers from financial market volatility. But this system had a crippling disadvantage. When building society interest rates were lower than market rates, savers were reluctant to deposit savings with them and commercial investors would not buy shares in them, since both could get a better return on their money elsewhere. With mortgage interest rates held artificially low, the building societies struggled to attract the capital they needed to offer mortgages, which were especially popular because they were so cheap.
Market interest rates stayed low between 1931 and 1964, so the building societies did not struggle to attract deposits. When there were hikes to the base rate of the Bank of England (the interest rate the central bank pays banks to deposit money with it, also known as the Bank Rate), and consequently market interest rates, these were short-term, generally lasting less than two years before they fell back to old levels. Although these rate hikes did start to empty building society coffers, they were brief enough that the societies could build up savings and investments when interest rates were low and their deposit rates were competitive, and then ration out this money in periods where finance was difficult to attract, in order to maintain a reasonable level of lending.
However, from 1964, Britain’s deteriorating economic situation led to volatile and elevated interest rates. This pushed the building society system to its limits.
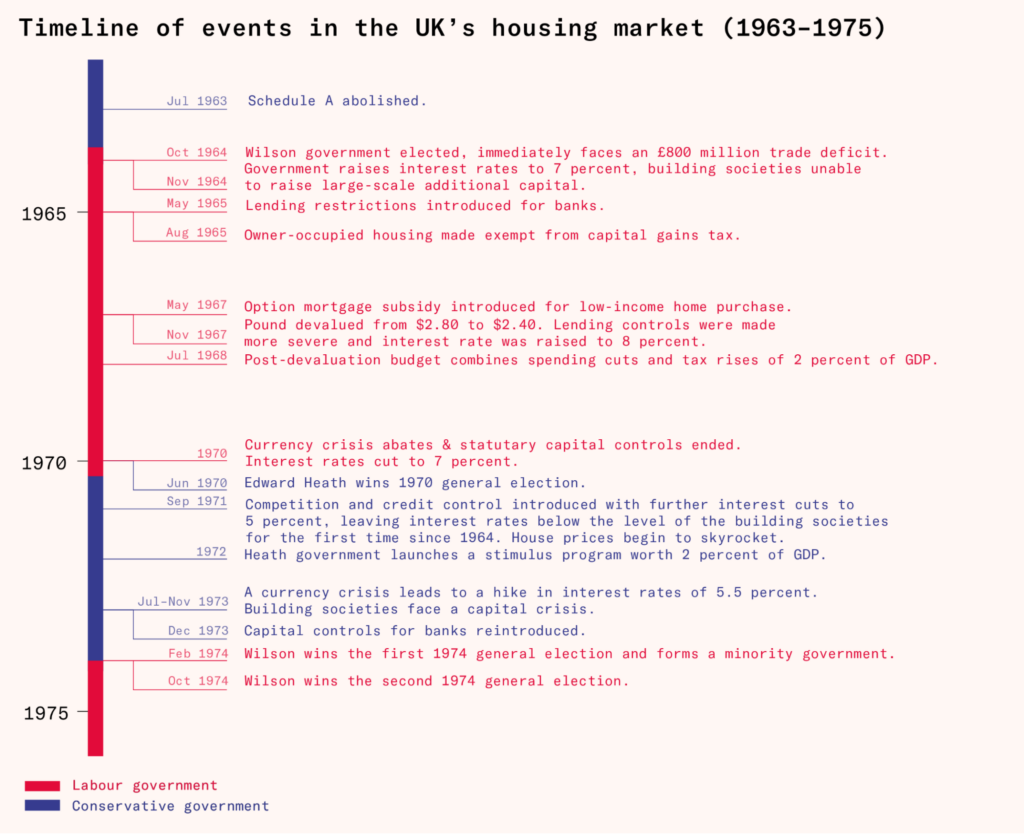
1964–1970: austerity and the balance of trade
Facing a severe trade and current account deficit under fixed exchange rates, Harold Wilson’s Labour government cut spending, raised taxes, and dramatically hiked interest rates to defend the pound. The high market interest rates began to dry up funds for mortgages, creating a de facto ‘definancializion’ of the housing market.
When Labour was elected in 1964, it took over from a 13-year Conservative government that had overseen persistently weak economic growth relative to Europe. Britain had an annual trade deficit of £800 million, equivalent to 1.8 percent of GDP. This deficit would have to be paid for by returns on foreign assets owned by Britons (most of which had been sold off already to fund the two world wars), borrowing from foreign lenders, or sales of and returns from domestic UK assets.
Under the flexible exchange rate system most countries have today, that would not be a problem. Many countries, including the United States, Poland, France, and Britain, have run trade deficits for long periods of time. In 2023, Britain’s was 2.7 percent of GDP, and it has been consistently negative for decades. The deficit has meant the pound becoming less valuable relative to other currencies, making British assets cheaper to invest in from abroad, so that the returns they give to foreign investors per dollar invested pay for the gap between exports and imports. Returns on assets act as a sort of export along with goods and services. The weakened currency also means that foreign goods and services become more expensive, so people buy less of them.
By contrast, under the Bretton Woods system that governed international monetary policy between 1945 and 1971, exchange rates were fixed. This meant that although the deficit was small by modern standards, it was impossible for Britain to sustain, since there was no mechanism for domestic assets to become cheaper and balance outflows of foreign currency with inflows, and nothing that would make foreign goods more expensive as foreign currency became scarcer.
Importers were running out of foreign currency, as not enough foreign buyers were interested in British exports or assets at the artificially high exchange rate peg. So people were unwilling to offer $2.80 for a pound in the market, and British companies and the government risked becoming unable to get the currency they needed to fund the things they were buying from overseas.
Investors started betting that the government would accept that sterling had become less valuable and devalue the pound to some point below $2.80. They did this in the same way George Soros famously did in 1992: by redeeming as many pounds as possible with the Bank of England at the official exchange rate, turning them into dollars. When the bank began to run out of foreign currency, the peg would become unsustainable and it would be forced to devalue the pound, and these investors would be able to immediately convert their dollars back into pounds at the new rate, making a quick profit.
Wilson initially refused to devalue, instead hoping to cut the trade deficit by reducing domestic demand, which he hoped would reduce demand for imported goods. This internal devaluation, as it is called, would also reduce wages and prices in Britain, making British exports more competitive in global markets.
However, Wilson did not want to use what would today be considered normal monetary and fiscal policy to achieve this – cuts to public spending and hikes to interest rates. He believed these would raise unemployment, impeding his central economic strategy to improve Britain’s long-run economic performance by increasing industrial investment and productivity. Increasing interest rates too much would make this policy impossible, as it would make borrowing to fund investment too expensive for both firms and the government.
Instead, Wilson found what he thought to be an ingenious solution to this problem. He would reduce wages and prices without increases in interest rates by simply forbidding prices and wages to increase. In 1965 the National Board for Prices and Incomes was set up and given the power to veto any increase in prices of manufactured goods, as well as wage rises agreed between trade unions and employers. In 1966 the board went as far as imposing a six-month freeze on all wages, prices, and dividends across the whole economy.
Central planning was introduced across financial markets. The Treasury and Bank of England simply told banks how much to lend. In May 1965, banks were ordered to cap their lending at 105 percent of the nominal monthly rate of March 1965 for two years. In 1966, the government promised to refer any future mortgage rate rises by building societies to the prices and incomes board, which would veto them. Building societies were effectively forbidden from any significant rise in interest rates on mortgages, and by extension a rise in their savings rates as well.
The combined effects of these two measures made it much harder for building societies to access funds for lending. The cap on mortgage rates meant that they could not offer higher rates to savers or investors, so they couldn’t access funds for lending. And the credit limits on commercial banks stopped people from resorting to them for lending instead. This meant that mortgage borrowers had to wait longer and longer to get funds to buy a house with.
Wilson’s industrial measures were unsuccessful. The growth rates and investment targets in his national plan for British industry failed to materialize. Britain’s dwindling reserves of dollars finally forced the government to devalue sterling to $2.40 in November 1967.
But there was still no trade surplus. In order to generate one, Wilson turned to extreme austerity in order to transfer resources from domestic consumption to export industries. The Bank of England, under direction from the International Monetary Fund, set direct targets for the supply of domestic credit. In May 1968 this was set at 104 percent of the November 1967 level, and in November 1968, this was tightened to 98 percent of the previous year’s level for all finance except for exports and shipbuilding. With inflation running at around five percent, these were significant real-
terms cuts to overall borrowing.
To increase the value of holding the pound and stave off further devaluation pressures, the Bank of England’s base interest rate was increased to eight percent, the highest level since the First World War. At the same time, the Treasury introduced spending cuts and tax rises worth
£923 million, or two percent of GDP, a level unprecedented in British history. In 1968, the Wilson administration became the only government in British history to have cut real-terms National Health Service spending in a budget.
Subsidies for homeownership
While mortgage funds were being dried up by a combination of severe fiscal austerity, credit controls, and fixed building society interest rates now being lower than the returns savers could get elsewhere, there was one exception to the Wilson government’s austerity. Wilson introduced a swathe of tax breaks for homeowners between 1963 and 1967, on the basis that they would help more people, including those on lower incomes, to own their homes. Demand for mortgages was starting to boom just as capital for mortgage lending was drying up.
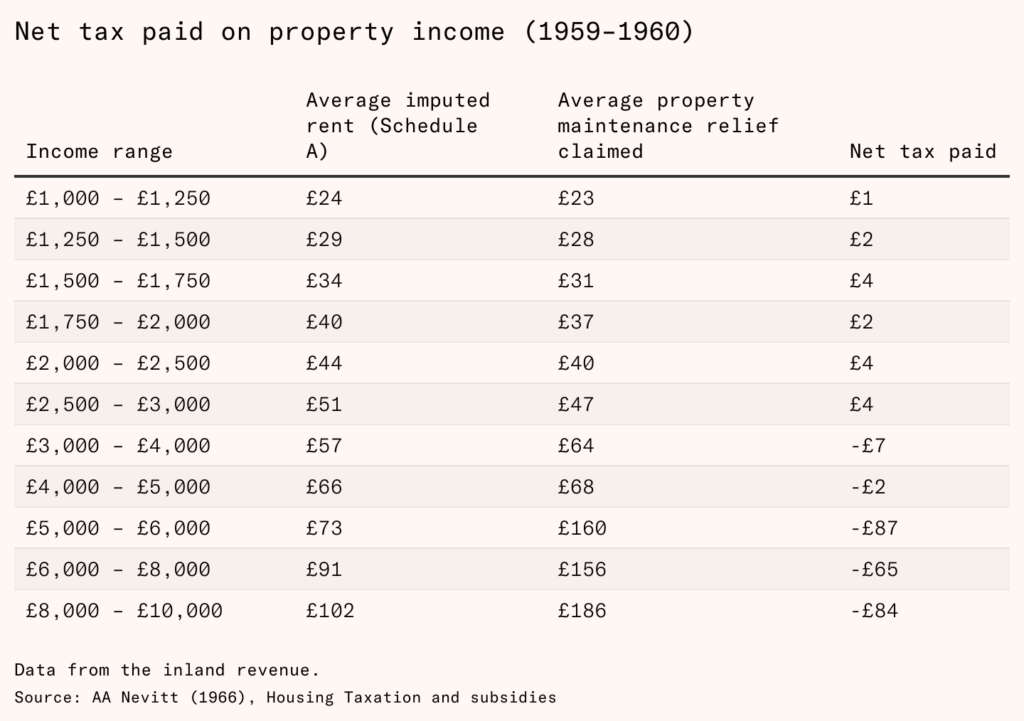
Before the 1960s, central government taxation of housing did not officially discriminate between tenures – owner-occupiers paid the same amount of tax as landlords would pay for a given property. This stemmed from the original 1803 design of income tax in Britain, which was collected according to five schedules of income, each covering a different income source – income from normal labor (E); income from professions, overseas, and from trading (B); interest and dividends (C); commercial rents (D); or residential rents (A). These different sources were taxed at different rates.
Schedule A was the tax on the rental income from a property. Crucially, owner-occupiers were also liable for this, even if they didn’t actually collect rents – their tax bill would depend on an assessment of what the property would earn if it was rented out. Like all income taxes, expenses paid on the property, like mortgage interest and maintenance costs, could be deducted from this tax bill.
In practice, the property tax system had favored owner-occupiers since the First World War. Owner-occupiers paid Schedule A income tax on the income value of the home, which was judged based on the rents paid by similar rented properties. But, since rent controls were widespread at this time, owner-occupiers paid tax at whatever the rent-controlled rate would be for their homes, without suffering the same loss of income that landlords did from rent control. The system also allowed them to deduct mortgage interest from any schedule, including income tax (Schedule E), at its full value. On top of this, the Valuation Office Agency gave up revaluing houses at all after 1937, as rapid house price inflation, in part driven by high wartime inflation, made revaluations politically controversial.
This meant that the property tax became insignificant for owner-occupiers. For higher earners with more expensive houses and mortgages, the mortgage interest deduction became a de facto subsidy, since they could write off the equivalent of their entire Schedule A property tax bill and an additional slice of their Schedule E income tax bill.
In 1963, Prime Minister Harold Macmillan abolished Schedule A – the tax on rent and imputed rent – altogether, but still allowed homeowners to deduct their mortgage interest from income tax. This was now a direct and explicit subsidy for homeowners.
Harold Wilson’s government further extended the tax advantages of owner-occupation. In 1965, it introduced Britain’s first capital gains tax, but left owner-occupied houses exempt, making them far more tax-advantaged than other assets now were. And in 1967 a direct mortgage subsidy was introduced for homeowners who did not earn enough to pay income tax and therefore deduct mortgage interest from their taxes.
These changes made during the mid-1960s had clear implications for the housing market. Other investments were all subject to tax – for example, dividends incurred income tax, and gains in share values incurred capital gains tax. Houses, however, were now subject to neither. In effect, it was a permanent interest rate cut for owner-occupied housing.
If housing supply had been elastic, as in the 1930s, or as it was across Europe in the immediate postwar decades, then easier money would lead to a building boom – new homes that were bigger, better quality, and in better locations. In 1967, three million homes, nearly one fifth of the English housing stock, lacked an indoor toilet, 3.4 million had no hot water, and in 1971 approximately only one third of homes had central heating. Similar de facto subsidies were used across Europe to encourage new building around this time, and largely achieved their intended purpose. The Macmillan and Wilson governments were motivated by good intentions: a desire to make it easier for poorer people to access better-quality housing, as was happening on the Continent through similar measures.
But what they did not realize was that, in Britain, housing supply could not increase easily, thanks to the Town and Country Planning Act’s restrictions on building out and up. Because of this, tax breaks for homeowners would increase prices without increasing supply or quality. Although they were a windfall for existing owners, anyone buying a house would use most of the extra money to bid up the price of the same housing stock.
Building society statistics reveal a pattern of mortgage rationing followed by price spikes in the housing market. From 1963–1964, strong demand for housing was driven by relaxed credit conditions and the elimination of Schedule A tax. Consequently, mortgage lending and house prices increased, as expected in a typical mortgage market.
The market dynamics changed in 1965 and 1966, despite more substantial tax cuts. Lending growth stalled as building societies faced financial constraints and could not raise sufficient funds to satisfy the growing demand. This situation created a bottleneck in the housing market.
The financial landscape further deteriorated following the currency devaluation in late 1967, exacerbating the challenges faced by building societies. The inability of these institutions to meet the market demand, coupled with the economic instability, led to a cyclical pattern of mortgage rationing and house price spikes, highlighting the volatility and inefficiencies in the housing market during this period.
Shrinkflation in the housing market
Throughout the second half of the 1960s a large proportion of people theoretically eligible to get a mortgage were not able to get one. The suppression of the mortgage market meant that measured real house prices were relatively stable. But there was a hidden side effect: homes were getting smaller and shoddier in Britain, despite housing subsidies, increasing incomes, technological improvements, and the fact that homes were getting bigger and better across the rest of Europe.
Mortgage finance was the scarcest ingredient. Housebuilders economized on mortgage finance by building smaller, lower-quality new homes, which required smaller mortgages – useful during a mortgage drought.
The house price-to-wage ratio appears to have been stable throughout the mid to late 1960s. However, the average quality of a house was decreasing: any given property was becoming less affordable, and this only translated into flat house prices because the average quality of a house bought was getting worse. The national price index for housing at the time did not take into account differences in housing quality, so this was not fully understood by contemporaries.
The government did not record data on home sizes in this period, but survey evidence from the Cooperative Building Society suggests 78.3 percent and 77 percent of newly constructed houses bought in 1966 and 1970 were built at a size below 1,000 square feet (93 square meters), compared to 71 percent of the existing stock being under this size. Nearly half of the existing stock had two reception rooms, while only one third of newly built houses did. And contemporary developer surveys suggest developers provided fewer amenities such as refrigerators, washing machines, and waste disposal units than had been normal.
By the end of the decade, the quality of new owner-occupied housing had slumped to the point where many contemporary observers thought that new buildings were inferior in quality to contemporary council houses. This seems to have been correct. The average floor space of a semi-detached house built between 1965 and 1980 was 785 square feet (73 square meters); the contemporary Parker Morris minimum space standard requirement for semi-detached council houses in 1969 was 818 square feet (76 square meters).
The decrease in housing quality in the late 1960s was the exact opposite of expected trends in a functioning market. During the decade, British real wages had increased by a third (despite Wilson’s wage freeze) and the cost of owning property was heavily subsidized by the government. People should have been buying larger and better-quality homes, as they were in all the European countries for which research at the Centre for Cities has produced consistent data: Austria, Norway, Sweden, and West Germany. Instead there was a combination of queues and declining quality – just like in the planned economies of communist Eastern Europe, where official prices were kept artificially low.
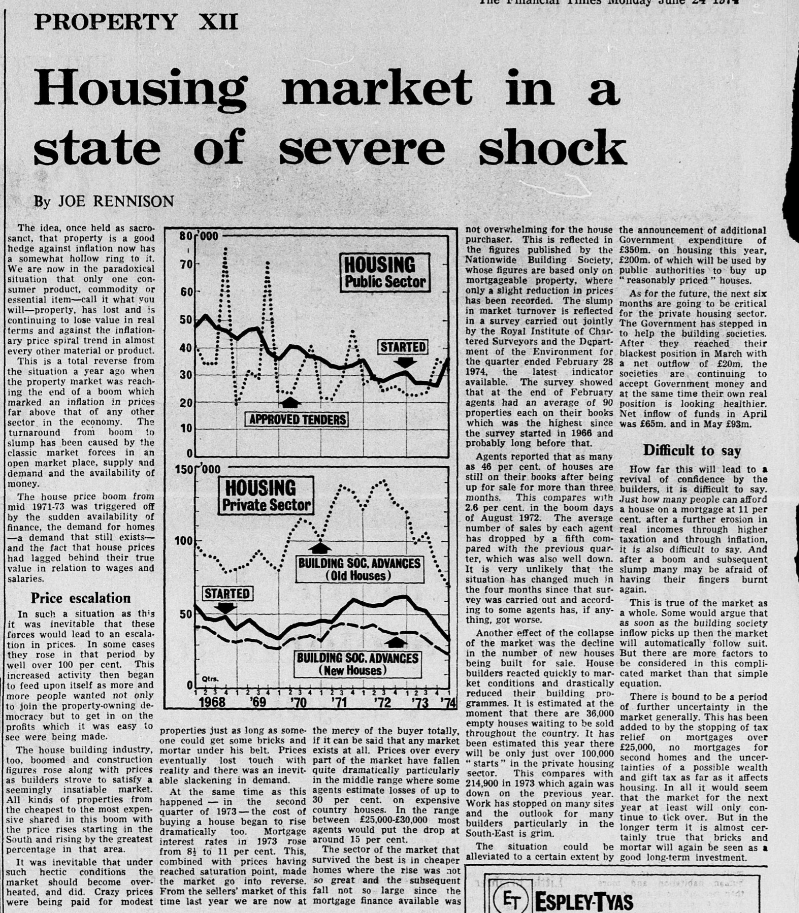
1970–1973: the Barber Boom and Britain’s all-time fastest house price growth
In 1970, the situation was suddenly reversed. Credit was suddenly unleashed by a combination of easy monetary and fiscal policy. Money flooded into the housing market. But since supply was still inelastic, it led to the fastest-ever house price rises in British history, rather than a credit-led building boom.
Domestic macroeconomic policy in the 1960s was primarily done with some form of fiscal policy – varying the size of the government deficit or surplus – or through direct price and wage controls. Rather than using interest rates to control the money supply, since 1965 the Bank of England had controlled credit directly, writing regular letters to hundreds of banks informing them of the amount they were permitted to lend that month.
Calculating and enforcing credit limits for every bank in England was extremely difficult and time-consuming. After the devaluation crisis ended in 1970 they were abolished. In 1971, Edward Heath’s new Conservative administration, which had defeated Labour in the 1970 election, replaced these lending controls with a new policy of using the central bank interest rate to control the overall money supply. The theory was that when the money supply became too loose they could raise interest rates to reduce it across the board, rather than laboriously calculating lending limits and sending them out to banks.
By 1972, unemployment had risen to a postwar record of over one million people, largely driven by the terminal decline of British industry. In March 1972, the government launched a ‘dash for growth’, targeting historically unprecedented real GDP growth of five percent for both 1972 and 1973. This was twice the average rate that the country had grown at since the war, and risky when inflation was already above seven percent. Nonetheless, the chancellor Anthony Barber announced in his 1972 budget what was then the largest peacetime fiscal stimulus in British history: a combination of tax cuts and spending increases totaling two percent of GDP of extra borrowing, which set off the so-called Barber Boom.
As the currency crisis abated, the Bank of England cut interest rates between 1970 and 1971. This brought market interest rates to below the five percent savings rate offered by building societies. This ended the disparity between what the building societies could offer their savers and investors and what other financial institutions could. Building societies could finally raise enough money to meet mortgage demand.
The net inflow of savings and investment funds more than doubled from £233 million in the first quarter of 1970 to £530 million in the final quarter of 1971. Banks and local councils, which had also had their ability to lend curtailed, were also freed to make mortgage loans again. Barber’s dash for growth coincided with an avalanche of new mortgage lending that had previously been suppressed.
Suddenly, anyone who met the lending criteria was able to obtain a mortgage and take advantage of the generous tax cuts that had emerged in the previous seven years. That caused an explosion in housing demand that had been repressed until this point. There was a 123 percent increase in mortgage lending between the beginning of the loosening of credit restrictions in the second quarter of 1970 and the peak of mortgage lending in the first quarter of 1973. By 1973, 40 percent of all mortgages on the books had been approved in just the previous two years.
But the supply side was still severely constrained. There was almost nowhere that could lawfully accommodate the sudden release of previously suppressed housing demand. Between 1970 and 1973, the price of the scraps of land that local planners had allocated for development more than doubled relative to the general price level, while housebuilding rates remained flat.
In the 1930s, easy money had led to a massive building boom. In the 1970s, easy money was leading to a massive price boom, as repressed inflation – people paying a constant price for a worse-quality product – turned into actual inflation – people paying a higher price for the same quality of product. A similar thing happened when price controls were lifted in Eastern Europe after the fall of communism.
Buyers competed desperately over the stock that already existed. House prices increased 70 percent relative to the price level between September 1971 and July 1973, the fastest real increase in British history. The fraction of the value of all houses sold made up by existing properties increased to 75 percent, up from around 60 percent in the mid-1960s.
1973–1974: The government hikes interest rates to defend the pound, causing the mortgage famine
Meanwhile, the Barber budget’s stimulus was overheating the general economy. Soon the government was forced to withdraw the stimulus, which crashed the mortgage market, causing a ‘mortgage famine’.
By July 1973 inflation had increased to nine percent and the pound was once again under pressure following the collapse of the Bretton Woods fixed exchange rate system earlier that month. Eventually, the government had no choice: that month, it hiked central bank interest rates by four percentage points to 11.5 percent in a last-ditch attempt to prevent another currency crisis. The government scrapped the policy of competition of credit control in December of that year and reintroduced quantitative controls over bank lending.
To avoid the risk of a run on the pound, it was unable to lower Bank Rate below ten percent until 1977 (except for two attempts that were abandoned after a few months), and restrictions on bank lending were not lifted until after Margaret Thatcher came to power in 1979. This was unprecedented in postwar history, and the rate rise was much more rapid than later permanent increases such as Britain’s currency crisis of 1992, which culminated in Soros’s famous attack on the pound. A chasm opened up between building society and market interest rates for which there had been no time to prepare.
The building societies faced their worst crisis yet. Savers and investors suddenly withdrew their funds from building societies, whose rates were negative in real terms, in search of better returns. From the second quarter of 1973 to the first quarter of 1974 gross withdrawals from building societies increased from £988 million to £1.4 billion. Building societies’ net receipts (savings deposited plus mortgage payments, minus money withdrawn) collapsed from £590 million in the second quarter of 1973 to just £13 million in the first quarter of 1974.
The situation was even worse than the gross figures suggested, since inflation was running at an annualized rate of 13.4 percent during the first quarter of 1974. This meant that the inflow of money to building societies was not enough to maintain their capital stocks relative to inflation. They were hemorrhaging money.
The Building Societies Association cartel refused to raise interest rates, due to both implicit government pressure and also because of the harm a rate hike could do to existing mortgagees. Doing so would cause large increases in the interest-dominated mortgage payments of the recent buyers who comprised two fifths of their total clientele. A previous rate rise from 8 to 11 percent in 1972 had increased the average payments on new mortgages by nearly a quarter. Given stalling house prices, any further rate increases raised the possibility of large-scale defaults. To avoid this, building societies continued to hold rates constant while market interest rates spiraled, and were forced to reintroduce mortgage rationing to an extreme degree. Lending by the building societies fell by more than half from its peak of £678 million in the first quarter of 1973 to £225 million in the second quarter of 1974.
This period of severe credit scarcity, which existed until central bank interest rates fell in 1977, became known as the mortgage famine. Housing market transactions froze and prices began to fall. This presented both the building societies and the government with a dilemma.
The building societies desperately needed inflows of cash. The most obvious way to get them was to increase the interest rates offered to depositors.
They had responded to previous interest rate rises in 1972 by increasing their mortgage rates from 8 percent to 11 percent. This had increased the average payments on recently lent mortgages by more than a fifth.
But by the beginning of 1974, new mortgages now accounted for 40 percent of building societies’ total clientele, and these new mortgages were particularly sensitive to interest rate hikes. Further rate hikes raised the possibility of large-scale strategic defaults, where mortgagors deliberately default on their loan as it is now substantially more expensive than the home to which it is secured. If this happened, it threatened all building societies’ solvency, and the complete collapse of Britain’s housing market.
1974–1977: Saved by stagflation
In the end, the building societies were saved from this complete collapse by two ironies of the mid-1970s: first, their mortgagees were swing voters, who switched party to get the government to prop them up, and second, rapid inflation wiped out all debts, saving the building societies at the cost of the housebuilders and savers.
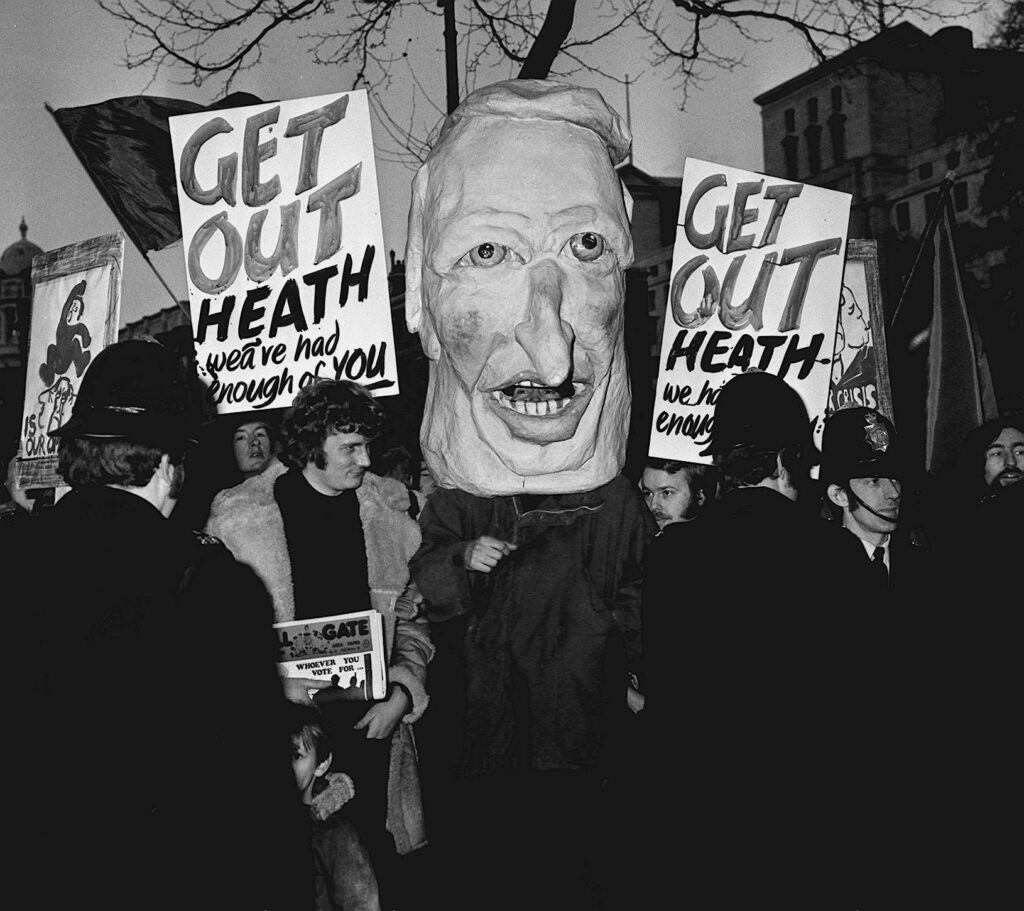
The first was political. In response to a coal miners’ strike, Edward Heath called an election in February 1974 under the slogan ‘Who governs Britain?’, which he promptly lost, allowing Labour to form a minority government under Harold Wilson. To strengthen his government, Wilson planned another election in the autumn, and sought to woo homeowners, who were a crucial bloc in marginal swing seats.
Wilson is reported by a former Treasury minister to have remarked that ‘either we prevented the mortgage rate going up and we would win the election, or we allowed it to go up and we would lose the election’. The Conservative opposition had likewise pledged to cap mortgage rates at seven percent. Wilson offered the building societies a deal: they would cap their mortgage interest rates at 11 percent, in exchange for being bailed out. The government would force the Bank of England to extend them a subsidized loan of £100 million (£907 million in current prices) at 10.5 percent, and provide £400 million (£3.6 billion in current prices) of Treasury funding over the year.
It was an offer the building societies couldn’t refuse, and it forestalled a massive negative equity and default crisis of all the recently sold homes for which mortgagors had taken out huge loans. Wilson also released large amounts of money to local authorities for the explicit purpose of mortgage lending to prop up the housing market, increasing their share of the mortgage market from seven percent of new loans in 1972 to 24 percent in 1975.
The second irony that averted wholesale collapse was the main symptom of the British economic predicament: soaring inflation.
In the previous summer, 1973, Heath had attempted to control rising inflation by negotiating a settlement of below-inflation wage rises with trade unions. To keep inflation below ten percent the government imitated Wilson’s price freeze and passed a law limiting wage rises in both the public and private sectors to seven percent. To show he was serious about combating inflation, and in order to reduce the fears trade unions had about large real-terms pay cuts, the policy contained a mechanism that allowed each employee to be given an extra one percent pay rise for every percentage point that inflation rose above seven percent. The hope was that limiting pay would limit inflation, so the clause would not kick in.
When OPEC, the cartel of oil-producing countries, raised the price of oil in October 1973, inflation increased above this level. This meant that government policy now mandated a constant wage-price spiral and inflation skyrocketed to double-digit levels. By December 1973, the money supply had grown by 72 percent compared to August 1971.
Neither Heath nor the weak Labour government that succeeded him could fully contain inflation, which peaked at 24 percent in 1975 and remained above ten percent in every year but one until 1982. Only the Thatcher government’s draconian monetary and fiscal policy, which focused on restraining inflation above all else, was able to bring it under control, at the cost of a major recession that increased unemployment to over three million.
From the perspective of borrowers, one benefit of this rapid unexpected inflation was the erosion of the real value of mortgage debt. Because of this, the rate of return on housing was positive for mortgagors throughout the mortgage famine, despite a fall in real house prices of 40 percent. There was no need for mass mortgage defaults, either strategic or involuntary. The economy suffered stagflation, but the failure of central government macroeconomic management inadvertently rescued the mortgage market.
Housebuilders were not so lucky. Having bought land at high prices during the period of inflation, many were now left with houses which no one could borrow money to buy. A wave of housebuilder failures began in 1974 and continued until 1977, including companies such as Northern Developments, then Britain’s second-largest housebuilder. And yet again, housebuilding was the loser. During this period, private sector housebuilding fell by one third from an already low level.
There is no alternative to supply
Writing amidst the housing market’s wreckage in 1974, Peter Hall painted a bleak picture of British housing. A ‘civilized British version of apartheid’ had emerged, in which the poor urban dweller was stripped of the possibility of good-quality housing at a reasonable price. This somewhat tasteless description was not entirely unwarranted. To any informed contemporary, it was clear by the mid 1970s that the housing policies of successive British governments had already failed. The combination of restrictive planning and tax incentives for homeownership had incentivized people to buy houses that could not be built.
British governments between 1964 and 1979 had instead ended up mostly influencing the housing market through the credit market. Lending limits, lending targets, and mortgage rates were all set centrally. But this caused dramatic financial instability. With tight credit – effectively definancialization – investment funds for housing were so scarce that new homes steadily got smaller and more poorly furnished. With easy credit, Britain saw its fastest recorded house price hikes in history. And when this was abruptly halted by a second freezing of available finance the entire housing market almost collapsed, saved only by a bailout and soaring inflation.
So, does choking off housing demand by cutting finance markets out of housing markets reduce house prices? Yes, but it is a narrow and ephemeral affordability. Nominal prices may fall, but this does not mean that people obtain better-quality housing for a lower price. Only increases in housing supply can lower the cost of housing for a given property, which is the value that matters for ordinary people.
No British contemporary thought the late 1960s or mid 1970s were a golden era for housing. Instead, the rationing and collapsing quality were considered a crisis in themselves. No amount of financial wizardry can obscure the fact that if you want people to have higher-quality and more affordable houses, you have to build them first. There is no alternative to supply.