How we calculate inflation has always been a subject of debate. Small changes that might seem trivial can lead to enormous changes in how well-off we think we are.
Every month, the US Bureau of Labor Statistics releases its newest data on the consumer price index (CPI). The CPI report is eagerly awaited by economists and policy wonks and investors. It garners heavy news coverage as a key piece of information in macroeconomic policymaking and analysis. The CPI and related measures affect monetary and fiscal policymaking and are often used to adjust Social Security payments, income tax brackets, and wages for millions of workers. Because of these far-reaching impacts, even relatively small changes in the measurement of the CPI can have major implications for households, firms, and the government’s budget. Thus, the technocratic task of measuring the price level is often at the center of political controversies. The evolution of inflation measurement in the United States has reflected both technical progress and these political forces.
The government’s role in the collection and publication of price indexes has been politically controversial from its origins, which were surprisingly late. Wesley Clair Mitchell, the former president of the American Economic Association, in 1921 called it:

Subscribe for $100 to receive six beautiful issues per year.
a curious fact that men did not attempt to measure changes in the level of prices until after they had learned to measure such subtle things as the weight of the atmosphere, the velocity of sound, fluctuations of temperature, and the precession of the equinoxes . . . Perhaps disinclination on the part of ‘natural philosophers’ to soil their hands with such vulgar subjects as the prices of provisions was partly responsible for the delay.
The first known price index was constructed by Count Gian Rinaldo Carli, an Italian professor and polymath, in 1764. Prices in Europe had been spiraling upward since the opening of trade with the New World. This ‘Price Revolution’, most notable in Spain and its neighbors, occurred with the inflow of large amounts of gold and silver. In Italy, many observers thought that prices were rising because Italy was getting richer as a result of accumulating gold from trade. To facilitate his study of rising prices, Count Carli collected prices of grain, wine, and oil from around 1450 and also from around 1755. For each commodity, he computed the percent change in price from the earlier to the more recent period. Then he took a simple average of those three percentage changes. This served as a basic measure of commodity price inflation. He did this using prices in terms of the Italian legal tender (lire), and then using prices in terms of gold and silver bullion. Prices in terms of lire had increased sharply, while those in terms of bullion rose only slightly. He concluded, therefore, that rising prices had resulted from the Italian government’s frequent debasement of the currency, rather than from growing wealth.
Governments around the world did not rush to adopt Carli’s methodology. Adoption came later, often driven by pressing circumstances. In the United States, one catalyst was the Civil War. To finance the war, beginning with the passage of the Legal Tender Act of 1862, the Union government began issuing paper money called greenbacks, unbacked by gold or silver. The greenbacks were the center of an intense debate about the constitutionality of paper money and the likelihood that it would lead to severe inflation. As the war progressed, Treasury Secretary Salmon Chase published rudimentary price indexes to demonstrate that, while high – prices roughly doubled during the war – inflation was not as bad as some feared.
Cost of living controversies
By the 1880s, labor unions were gaining strength and coming into frequent conflict with employers about whether wages were keeping up with price increases. Labor unions pushed for the creation of a government agency that could promote their interests. Employers, unsurprisingly, resisted. As a compromise, the Bureau of Labor was established in 1884, and was directed to simply collect and publish statistics about labor, without taking a particular stance.
The Bureau of Labor soon came to play an important role in the publication of price indexes. One impetus was the Republican Party’s McKinley Tariff of 1890, which sharply increased import duties in an attempt to protect American manufacturers from foreign competition. Labor activists claimed that the tariff had led to higher prices but lower wages. Senator Nelson Aldrich, a Rhode Island Republican best known for his role in the founding of the Federal Reserve, commissioned a committee to study whether this claim was true. His committee asked the Bureau of Labor to construct wholesale and retail price indexes from 1860 to 1891 – an effort that required collecting 52,393 price observations by hand. The committee’s report showed that prices had indeed risen after the tariff, but that wages had risen more than prices over a longer time period.
The bigger implication of the report was to demonstrate that it was feasible for a government agency like the Bureau of Labor to collect price data and publish price indexes. The report set a precedent for subsequent studies – studies which played a role in the important political debates about the monetary system in the 1890s. The return to the gold standard after the Civil War brought about a long period of deflation. This deflation was painful for farmers, who tended to be debtors, because it increased their real debt burden. In his famous ‘Cross of Gold’ speech at the 1896 Democratic Convention, the populist politician William Jennings Bryan advocated using monetary expansion to reverse the deflation and stabilize prices. Monetary expansion, he thought, could be achieved by monetizing silver or by issuing more greenbacks.
Around the turn of the twentieth century, the Bureau of Labor’s price index data allowed Progressive Era (1896–1917) economists – most notably Irving Fisher – to think for the first time about how in practice the government could stabilize prices in the economy if it wished to. Before Fisher’s work, economists used the Paasche index and the Laspeyres index to create price indexes. Both try to account for the fact that the quantities of each type of good consumed can vary from period to period, largely because when the relative price of a particular good rises, consumers reduce their consumption of it, but both indexes account for this varying consumption in a way that biases the resultant index.
The Laspeyres index weights prices by their quantities in the initial (base) period, meaning it doesn’t account for falls in consumption of a good driven by higher prices, and it tends to overestimate inflation. By contrast, the Paasche index weights prices by quantities in the later period and underestimates inflation, as consumers are not able to switch to cheaper products instantaneously. Fisher proposed taking the geometric mean of the Laspeyres and Paasche indexes (that is, multiplying them together and taking the square root) to avoid either the upward or the downward bias. This is now standard.
Following the financial panic of 1907, Congress created the National Monetary Commission to study reforms to the US banking and monetary system. The work of the commission led to the creation of the Federal Reserve System in 1913, with the aim of promoting financial and monetary stability. Based on his studies of the relationship between inflation and interest rates, Fisher hoped that the Federal Reserve would pursue price-level stabilization. Instead, the Federal Reserve Act of 1913 kept the United States on the gold standard, and charged the Fed with maintaining the dollar’s convertibility to gold. Fisher continued to push for a price-level stabilization mandate for decades to come.
Rising prices in World War I led to further developments in official inflation measurement. A poor wheat harvest, and increased purchases of American crops by the British, French, and Italian governments, led to rapid increases in food prices, resulting in food riots in major United States cities. President Woodrow Wilson initially resisted calls for the government to intervene to lower food prices, either by implementing price controls or restricting exports. But after the United States entered the war, Wilson and Congress agreed to the establishment of a complicated system of price regulations and rationing on strategic goods, including coal, copper, iron, steel, and lumber, and also certain wage controls. These interventions held down certain costs and prevented hyperinflation, but overall inflation remained high.
The government recognized that controlled wages needed to keep up with cost-of-living increases. But how to measure cost-of-living increases? The secretary of labor suggested that wages should rise to the same extent as a retail food prices index. But food prices were rising more quickly than other prices. Thus, the Bureau of Labor – by then renamed the Bureau of Labor Statistics (BLS) – conducted studies of consumers’ expenditures to use to construct a new cost-of-living index, which weighted different price changes by their shares in consumer expenditures, or expenditure weights. This provided a more comprehensive measure of how inflation affected a typical consumer’s expenses, and could be used as a benchmark for wages.
In World War II, when a much broader system of wage and price controls was imposed, the cost-of-living index drew criticism from labor leaders, who claimed that it grossly underestimated the true extent of the increase in the cost of living. Wage increases, they therefore argued, had not been sufficient to preserve workers’ purchasing power. One criticism of the cost-of-living index, for example, was that it did not account for so-called forced uptrading. When manufacturers were prohibited from raising the prices of their products, they sometimes discontinued their lower-quality lines, forcing consumers to switch to higher-quality lines with higher prices and profit margins.
A nonpartisan committee, appointed to investigate the cost-of-living index, concluded that the labor leaders’ claims had little merit; any mismeasurement was likely quite small. Frederick C Mills, the Columbia University economics professor appointed to head the committee, concluded that ‘within the limitations established for it, the cost-of-living index provides a trustworthy measure of change in the prices paid by consumers for goods and services’. His report did not end the controversy, however, and President Franklin Roosevelt commissioned another committee to study the cost-of-living index. The president’s committee agreed with Mills that the index provided ‘a competent measure of price changes for goods customarily purchased by families of wage earners and lower salaried workers living in large cities’, but acknowledged that the term cost of living could be confusing for the public, especially when wartime conditions worsened their standard of living in a variety of ways. Thus, the index was renamed the consumer price index to emphasize its use as a measure of prices, and not necessarily of living standards.
The Stigler Commission
Since wages in union contracts were often indexed to the CPI, labor leaders continued to contend that the CPI underestimated inflation even after the war. The United Auto Workers, for example, argued that the CPI should include taxes. Management countered that the index instead overestimated inflation because it failed to take into account quality improvements in products. This debate became highly politically salient; as a 1949 report noted:
The widespread and increasing use of the Index in union-management contracts, the most recent being the General Motors-United Automobile Workers agreement, has made the Consumers’ Price Index almost a household word. Formulation, adjustments, weighting, and other matters involved in its presentation have become of increasing public importance.
The Stigler Commission (headed by later Nobel Prize-winning economist George Stigler) that investigated labor’s complaints about the CPI was more sympathetic with management’s arguments, and some of its recommendations have led to important changes in how the CPI is calculated. First, the Stigler Commission recommended further research into accounting for quality changes in price indexes. For example, at the congressional hearings about the commission’s work, George Stigler explained that ‘automobile prices were considerably overstated in their increase during the 1950’s by failing to take account of horsepower, weight, length, and so forth’. That is, although car prices had risen, cars had improved along a number of dimensions. Part of the rise in price should be attributed to this quality improvement, and not to inflation. Consumers were paying more not for the same good, but for a better good.
As Representative Thomas Curtis noted at the hearings, adjusting appropriately for quality improvements was critical to allow the inflation data to guide policymaking appropriately. His example came from the healthcare sector, for which price indexes were increasing rapidly:
If it has been that the increased price in the area of health cost has come as a result of tremendous quality advancements, then the organization in the sector of the health field has been doing an excellent job, and we don’t want to direct our primary attention to messing around in that sector, certainly not in a drastic way. Yet that is exactly the proposals that are before this Congress and have been for years . . . I am only directing attention to the importance of statistics and economic series in giving us accurate information so we can make policy decisions intelligently.
Today, the BLS uses a method called hedonic adjustment to account for quality changes for certain types of items. This is a statistical approach that estimates the contribution of different characteristics of the item to its price using regression analysis. Having worked out how much each feature is worth – for personal computers, for example, the main characteristics used in the hedonic adjustment include the speed of the central processing unit, amount of random-access memory (RAM), and hard drive storage capacity – then prices can be deflated by quality changes. Hedonic adjustment has been especially important given innovations in cars and information technology.
As well as quality adjustments, the Stigler Commission recommended broadening the target audience for the CPI. At the time, the Bureau of Labor Statistics tracked the spending patterns of urban clerical workers – that is, urban or metropolitan-area households in which at least half of the income comes from clerical or wage occupations, and at least one earner has been employed for at least 37 weeks during the previous year. In 1978, the BLS began tracking the spending patterns of all urban consumers – a group that also includes professional, self-employed, unemployed, or retired people, in addition to urban clerical workers, and accounts for about 90 percent of the population. The expenditure shares of this broader population are used as weights when constructing the CPI today. The price of each item in the index is multiplied by that item’s share of consumption for a typical urban consumer.
The Boskin Commission
The next extensive external evaluation of the CPI came several decades later, in 1995, when the Senate Finance Committee appointed an Advisory Commission to Study the Consumer Price Index, headed by Michael Boskin, an economist who had served on President George HW Bush’s Council of Economic Advisers. The Boskin Commission estimated in late 1996 that the CPI had overstated inflation by about 1.1 percentage points per year in 1995 and 1996 – a very large bias that would result in substantial overestimates of the price level when compounded over multiple years. Part of this measurement bias came from substitution effects. If the price of red apples rises, consumers may switch to green apples. If the price of apples at Krogers rises, consumers may switch to apples at Walmart. If the prices of all apples rise, consumers may switch to bananas. Thus, the prices people pay do not rise as much as the price index rises if substitution effects are not accounted for.
Another major source of measurement bias came from the introduction of new products like VCRs and cell phones. It had taken over a decade for these new products to be included in the CPI. But the prices of these items had fallen substantially in their first decade. Since the CPI missed the period of major price declines, it had overstated inflation. The commission recommended changes to the index formula to account for substitution effects and more rapid introduction of new goods and services into the index. It also recommended that the BLS devote less of its efforts to sampling the prices of items with minimal quality changes (like apples and bananas) in order to focus more attention on prices of goods with major quality changes and goods whose prices varied a lot across locations. The economist Robert Gordon, who was a member of the commission, explains why the report caused political shock waves when it was first released:
The enormous amount of journalistic attention given to the Commission’s findings reflects the central role of CPI measurement in almost every major economic issue. A bias in the growth rate of the CPI contaminates official estimates of growth in output and productivity, median income, and real wages; it alters the growth rates of government tax revenues and spending programs that are indexed to inflation; it has major consequences for the time path of the government budget deficit and national debt; it produces misleading estimates of inflation for monetary policymakers for whom the inflation rate is a critical target; it distorts estimates of poverty rates; and it clouds comparisons of the comparative economic performance of nations.
The implications for government tax revenues and spending were the most attention-grabbing. In September 1995 The New York Times reported that the Boskin Commission’s estimate that fixing CPI bias ‘could reduce the Federal deficit by $634 billion over the next 10 years’ (that is, between 1995 and 2005) by reducing the need for Social Security and other benefits programs linked to the index to grow as quickly. This suggestion appealed to members of Congress looking for a quick way to cut spending and reduce the budget deficit, but was condemned by lobbyists from the American Association of Retired Persons, who did not want to risk a cut in the cost of living adjustments to Social Security and other benefits. As it turned out, a major reduction in the budget deficit in the years following the report reduced the sense of political urgency surrounding the report.
Still, the commission did have important impacts on BLS methods. In 2002, the BLS began updating its expenditure weights every two years, instead of every decade or so. To estimate these expenditure weights, which represent the share of consumption that households spend on each category, the BLS relies on the Consumer Expenditure Surveys, which consist of an interview survey and a diary survey. The interview survey asks respondents about large or recurring expenses, like property, automobiles, major appliances, rent, and utilities. The diary survey has respondents collect information about other purchases that may be more frequent and harder to remember, like food and beverages.
Also in 2002, the BLS began publishing a chained CPI, which uses a different formula to account for some of the substitution effects that the Commission highlighted. For a simple example, suppose that in year one, households spend half of their income on apples and half on bananas, and both apples and bananas cost one dollar per pound. In year two, bananas are still one dollar per pound, but apples increase in price to two dollars per pound. Using the expenditure weights from year one, the price level in year one is 0.5*$1+0.5*$1=$1. The price level in year two is 0.5*$2+0.5*$1=$1.50. The increase in the price level is 50 percent. But it is very likely that households won’t continue spending the same share of their income on apples when apples have increased in price relative to bananas. Suppose the expenditure weight on apples falls to 25 percent and the expenditure weight on bananas rises to 75 percent. Using the year two expenditure weights, the price level in year one is 0.25*$1+0.75*$1=$1, and the price level in year two is 0.25*$2+0.75*$1= $1.25. The increase in the price level is 25 percent. The chained CPI computes both of these inflation rates and takes the average.
Chained CPI inflation is lower than unchained CPI inflation, because it accounts for the lower weight on goods that become relatively more expensive (like apples, in the simple example). As shown in the chart opposite, the traditional and chained CPI measures track each other closely, but chained CPI is around a quarter of a percentage point lower than the traditional measure.
In 2014 and 2015, President Barack Obama proposed using the chained CPI, rather than the CPI, to adjust Social Security benefits, as part of an effort to reduce government spending to reduce the federal deficit. Congress rejected this proposal, which Representative Greg Walden, a Republican, described as ‘a shocking attack on seniors’ and ‘trying to balance the budget on the backs of seniors’.
Eventually, the chained CPI did make its way into fiscal policy. Tax brackets are normally adjusted for inflation to keep inflation from pushing consumers into higher tax brackets. The Tax Cuts and Jobs Act of 2017 began using the chained CPI, rather than the standard CPI, to index tax brackets to inflation. This means that tax brackets do not increase as quickly as they would have if using the standard CPI, so more consumers end up in higher tax brackets. The Joint Committee on Taxation estimated that this change would increase the government’s tax revenues by about $134 billion over the first ten years.
A basket of measures
The CPI remains one of the most important inflation measures in the US today, but it’s not the only one. Another is the personal consumption expenditures (PCE) price index, produced by the Bureau of Economic Analysis (BEA, an agency within the Department of Commerce that publishes other key national statistics, including GDP). Because of some differences in construction and coverage, CPI inflation is usually around half a percentage point higher than PCE inflation. The chart opposite shows how the PCE grows more slowly than the CPI.
One major difference between the PCE and CPI is that the PCE has a broader scope than the CPI. The CPI only includes goods and services purchases made out of pocket by urban households. The personal consumption expenditures index covers these purchases, but also includes the purchases of rural households (ten percent of the population) and, importantly, goods and services consumed by third parties on behalf of households, most notably healthcare. Medical care services paid through employer-provided health insurance or Medicare and Medicaid are in the PCE, but not the CPI. This means the PCE weight for healthcare services is substantially higher than the CPI weight for healthcare services.
Because the PCE includes these additional types of expenditures, the weights on categories that it shares with the CPI are smaller. Most notably, the weight on housing in the CPI is 33 percent, compared to just 15 percent in the PCE. Strong house price growth has contributed to the gap between the CPI and PCE. The gap also comes from how the PCE accounts for consumer substitution.
The two indexes have different uses. The federal government uses the CPI measure to index benefits like Social Security, and for Treasury inflation-indexed bonds. The Federal Reserve, long after Fisher’s death, affirmed its commitment to price stability by announcing an explicit two-percent inflation target in 2012. Fed policymakers on the Federal Open Market Committee carefully considered which index to use when defining their target. They settled on the PCE, rather than the CPI, because of its more comprehensive coverage and how it accounts for substitution effects (yet another major price index, the GDP deflator constructed by the Bureau of Economic Analysis, is even broader, but data is released too slowly for it to be useful to rate setters). For former St. Louis Fed president James Bullard, the discrepancy between the Fed’s use of the PCE and the federal government’s use of CPI is reason for pause: if the PCE really is the better measure, then using the CPI to uprate benefits means continually growing their real value over time unintentionally.
Though the Fed officially targets PCE, it takes many different inflation measures into account as it tries to understand the sources of inflationary pressures and to forecast where inflation is headed. A wide and growing variety of measures is available not only to policymakers, but also to researchers. Most importantly, for both the PCE and the CPI, both headline and core measures are available. Core measures exclude certain highly volatile prices, such as, typically, food and energy prices. These core measures thus result in smoother inflation series that can give better insights into longer-run trends, and are less driven by supply shocks. Paul Krugman, a Nobel Prize–winning economist and New York Times opinion columnist, explains that ‘we don’t exclude these prices because we think they don’t matter, but because they fluctuate in ways that can lead to policy mistakes’. For example, although the Fed officially targets headline PCE inflation, monetary policymakers pay careful attention to core inflation measures because they want to avoid responding to changes in energy or commodities prices that are likely to be temporary or that reflect supply-side phenomena that monetary policy cannot address.
The traditional core inflation measure, which excludes food and energy, is not a perfect measure of underlying inflation. Prices other than food and energy might swing because of supply shocks, as was the case with used car prices when pandemic-related disruptions to global car production and a computer chip shortage reduced the supply of new cars, in turn raising the demand for and price of used cars. Another issue is that shelter prices have a weight of about 40 percent in the core CPI excluding food and energy, and shelter price inflation is difficult to measure.
For renter-occupied housing, the cost of shelter is the rent. For owner-occupied housing, the cost is an estimate of the owner’s equivalent rent – the rent that the owners would be paying if they were renting. These estimates are subject to errors, which can be quite large during and after a big surge in housing prices, as occurred in 2021. There is no international consensus on the treatment of rents in price indexes, and differences in shelter and rent inflation sometimes explain large differences in inflation between the United States and other countries.
Other varieties of core inflation measures address some of these issues. Instead of excluding the same categories (food and energy) each month, an alternative is to exclude the categories that exhibited the biggest rises and declines in price in that particular month. This is the approach of trimmed mean or median measures that are available for both the CPI and the PCE. The trimmed median and mean measures from the Federal Reserve Bank of Cleveland are shown in the graph below. Like the core-less-food-and-energy series, they are smoother than the headline CPI.
The Federal Reserve Bank of Atlanta publishes several sticky price CPI measures, which only include items that change price relatively infrequently, like public transportation, medical care services, and motor vehicle insurance. When sellers know that they can only make price changes infrequently, they need to be forward-looking, taking expected future inflation into account when setting their prices. Thus, like core measures, sticky price measures may be useful in forecasting where inflation is headed. Other central banks, including the Bank of Japan, also rely on a variety of different inflation measures when assessing inflation developments.
The availability of such a large variety of inflation measures can sometimes lead to controversy, as commentators’ choices about which measures to emphasize can be interpreted as politically driven. In June 2023, Krugman used a very narrow ‘super core’ measure – consumer prices excluding food, energy, used cars, and shelter – in a New York Times op-ed following the release of the CPI report for May. As can be seen in the chart above, the super core measure fell more rapidly than the standard-less-food-and-energy measure in 2023. At the time of Krugman’s op-ed, the standard core measure remained elevated, but the super core measure, instead, painted ‘a clear picture of disinflation’. A few months later, in October, he posted a graph of super core inflation on X with the caption, ‘The war on inflation is over. We won, at very little cost.’ Krugman’s focus on this super core measure received considerable pushback; he was mocked for ‘saying inflation is over if you just exclude most of what people buy’. In turn, he accused his critics of ‘disinflation denial’ for refusing to believe that inflation was actually falling.
Scrutiny and credibility
At the time of writing in 2024, inflation is falling by nearly any measure. But as Krugman’s super core episode illustrates, the past few years have intensified public scrutiny of official price indexes and led to debates about their interpretations. In light of this scrutiny, it is important for national statistics agencies to maintain their credibility by adopting methodological improvements, learning from both the private sector and academic researchers, and communicating clearly with the public.
Just as the Bureau of Labor Statistics responded to the Stigler and Boskin Commissions by revising its methods, it has also responded to the Covid-19 pandemic and post-pandemic inflation. For example, the pandemic demonstrated that biennial (every other year) updates to the CPI expenditure weights are too infrequent in times of rapid economic changes. The pandemic very quickly shifted the types of goods and services that people were buying, so expenditure weights based on survey data from 2018 became out of date. People were spending more on food and other items facing large price increases, and less in categories experiencing falling prices, like transportation, implying that the official CPI measure was underestimating inflation.
The Bureau of Labor Statistics could not move quickly enough to change its estimates of expenditure weights, but private researchers could. The economist Alberto Cavallo used data collected from credit and debit card transactions to build his own set of weights that he used to construct a new Covid CPI measure, which indeed rose more quickly than the official CPI in the first months of the pandemic, as shown in the figure on the following page.
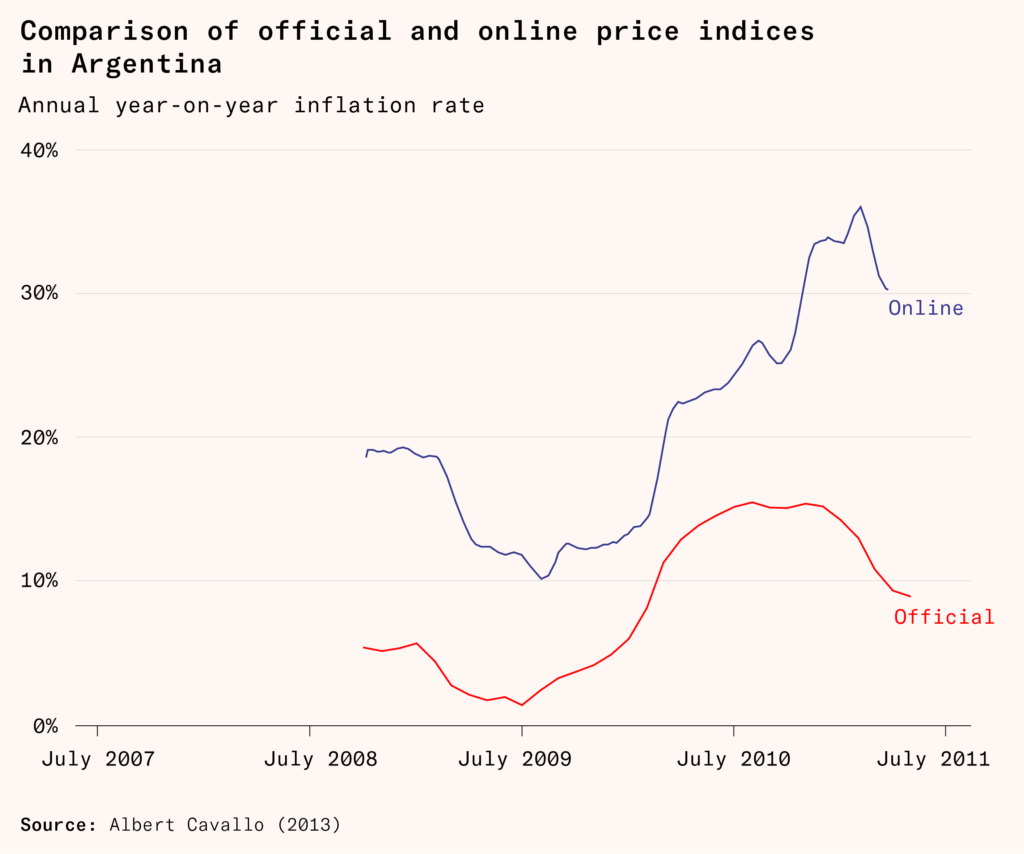
Cavallo’s experience constructing alternatives to official inflation statistics began when his home country, Argentina, began doctoring its inflation statistics in 2007 to hide inflation that rose above 12 percent in 2006 and likely averaged above 20 percent from 2007 to 2011. Cavallo and a group called the Billion Prices Project at MIT used web-scraping techniques to collect the prices of goods sold online in Argentina and four other Latin American countries. For all but Argentina, the price indexes based on online prices closely tracked official price indexes, but for Argentina, Cavallo’s estimates of inflation were three times higher than official estimates, and Cavallo’s estimates soon became more trusted than the official statistics.
Cavallo and the other researchers behind the Billion Prices Project have since extended their methodology to other countries, including the United States. In 2011, they started a private company called PriceStats that produces daily-frequency inflation measures for central banks and financial-sector customers in 25 countries, including the United States, using data on millions of product prices from hundreds of retailers.
In the United States, private inflation estimates may supplement the official estimates, but are unlikely to replace them. In part, this reflects the statistical agencies’ willingness to refine their methods, learn from private researchers, and maintain methodological transparency. For example, having learned that biennial expenditure weight updates are too infrequent, the BLS will update its expenditure weights every year beginning in 2023. The BLS also recently sponsored a study, Modernizing the Consumer Price Index for the 21st Century, to investigate additional improvements to the CPI that could be adopted in years to come. The study’s panelists considered a variety of innovations by Cavallo and other researchers, and recommended that the BLS experiment with using a wider variety of data sources, including online transactional data, to improve the timeliness and accuracy of its estimates.
The development of price and inflation measures has often been driven by political controversies, especially during times of war or during labor disputes. The development of the consumer price index arose from a need to ensure that wages and benefits would keep up with the cost of living. The recommendations of several different commissions have led to changes in how the index is computed – changes that have major impacts on the federal budget and on the distribution of resources. Especially in recent years, alternative inflation measures have proliferated. Overall, the official price indexes represent a tremendous intellectual and public achievement, despite the debates that continue to surround their use and interpretation.